DATA AND ANALYTICS ENGINEERING CASE STUDY
Delivery Standardization & Cost Optimization Platform
Enterprise analytics platform designed to standardize delivery performance measurement, identify operational inefficiencies, optimize delivery frequency, reduce transportation costs, and improve sustainability visibility.
Portfolio Recreation
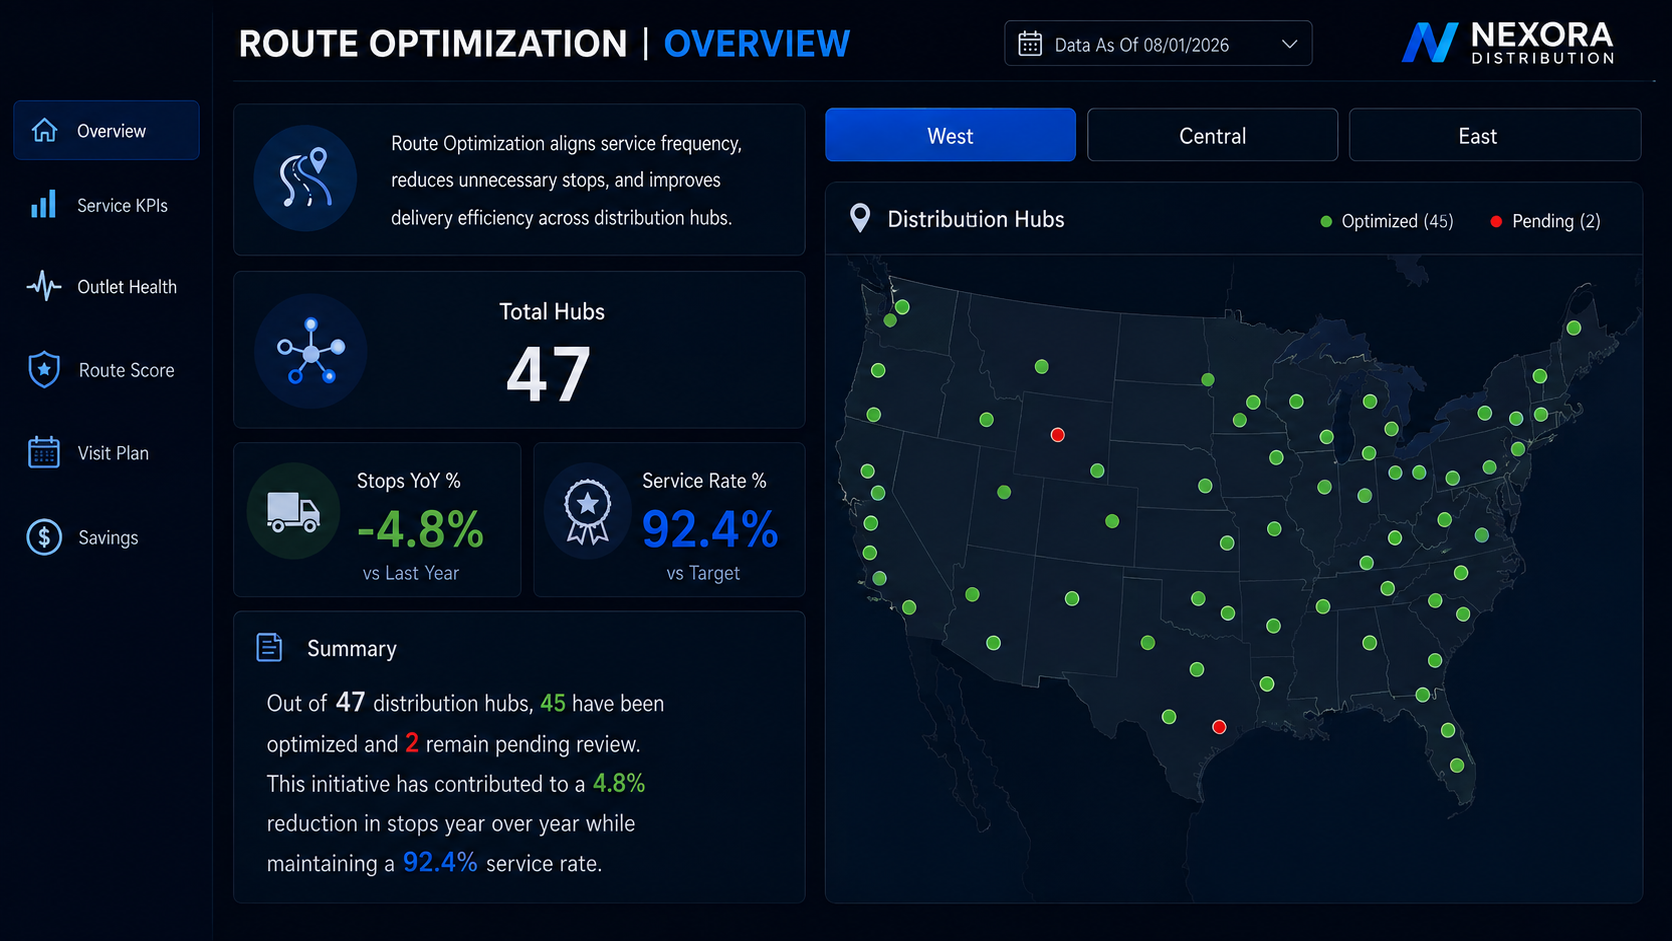
Route Optimization Overview
Executive-level view of distribution-center coverage, route optimization status, stop reduction, and service performance.
Synthetic portfolio recreation. No proprietary company data is shown.
Business Challenge
Distribution operations can suffer from inconsistent delivery frequencies, inefficient routes, increased transportation costs, driver overtime, and limited visibility into operational performance.
Solution Architecture
The platform follows a layered analytics architecture that moves operational delivery data from raw ingestion through standardized business models and finally into governed Power BI analytics.

Step 1
Operational Sources
Orders, drivers, routes, vehicles, customer and delivery data
Step 2
Bronze Layer
Raw operational data ingestion and historical storage

Step 3
Silver Layer
Cleaning, validation, business rules, and standardization

Step 4
Gold Layer
Business-ready fact tables, dimensions, and star schema

Step 5
Semantic Model
Relationships, DAX measures, KPIs, and reporting logic
Step 6
Executive Analytics
Route, delivery, cost, productivity, and performance dashboards
End-to-End Data Flow
Data Engineering
SQL and Python pipelines ingest, clean, validate, and standardize operational delivery data.
Analytics Modeling
Gold-layer fact and dimension tables support reusable business logic, KPIs, and semantic modeling.
Business Intelligence
Power BI dashboards surface delivery, cost, productivity, route, and optimization insights for operational leaders.
Dashboard Capabilities
The analytics layer was designed to help operational leaders move from static reporting toward actionable delivery-performance monitoring and route optimization.
Network Visibility
Monitor distribution-center activity and regional delivery performance from a centralized view.
Stops Analysis
Compare stop volumes and year-over-year movement to identify changes in delivery activity.
SLA Monitoring
Track service-level performance and highlight areas requiring operational attention.
Rerouting Analysis
Separate rerouted and non-rerouted delivery activity to monitor optimization behavior.
Geographic Analytics
Visualize regional delivery activity and operational coverage using map-based analysis.
Executive Decision Support
Provide leadership with concise KPI summaries for delivery-standardization decisions.
Operational Analytics
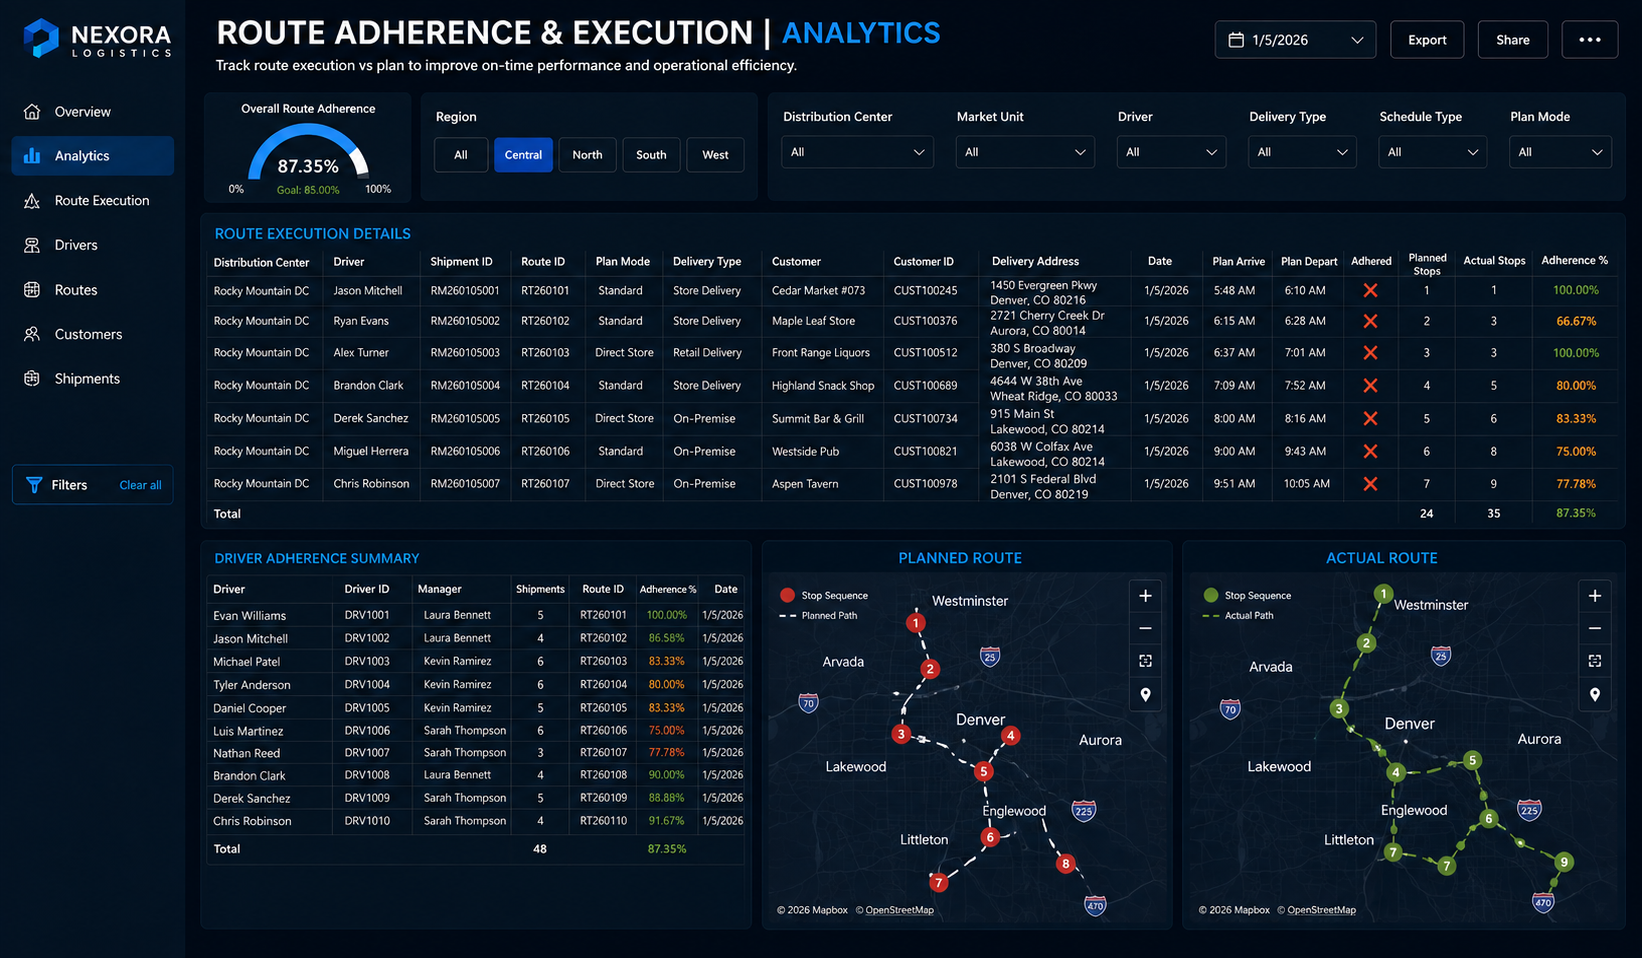
Route Adherence & Execution Analytics
Detailed operational view comparing planned versus actual routes, driver adherence, stop sequencing, route-level exceptions, and execution performance.
Planned vs Actual
Compare planned route sequences with actual execution.
Driver Adherence
Measure route-level and driver-level adherence performance.
Stop Variance
Identify additional, skipped, or reordered stops.
Execution Exceptions
Highlight routes requiring operational follow-up.
Portfolio recreation using synthetic names, identifiers, route data, addresses, and performance values.
Data Model Design
Fact Tables
- FactDeliveryOrders
- FactDriverProductivity
- FactFuelPurchases
Dimension Tables
- DimCustomer
- DimDriver
- DimVehicle
- DimMaterial
- DimRoute
Key Analytics & KPIs
Service
OTIF, SLA, On-Time Delivery
Productivity
Cases per Hour, Cases per Stop
Financial
Cost to Serve, Cost per Stop
Customer
Delivery Frequency Analysis
Sustainability
Fuel and CO₂ Metrics
Optimization
Frequency Recommendations
Technology Stack
Business Impact
- ✓ Reduced delivery stops by 12.5% through delivery frequency optimization
- ✓ Reduced transportation costs by 23% through logistics and route analytics
- ✓ Improved driver and delivery productivity through KPI-driven performance analysis
- ✓ Enabled cost-to-serve analysis to identify high-cost and low-efficiency deliveries
- ✓ Built executive Power BI analytics for delivery performance, productivity, and cost optimization
Portfolio Note: Dashboard visuals on this page are recreated for portfolio demonstration using synthetic and anonymized data. They illustrate solution patterns and analytics capabilities without exposing proprietary company information.